
Pipeline Coverage Ratio: Formula & Benchmarks Explained
Learn what pipeline coverage ratio means, the formula to calculate it, and realistic benchmarks by win rate, deal size, and sales cycle.
By Rishabh ·
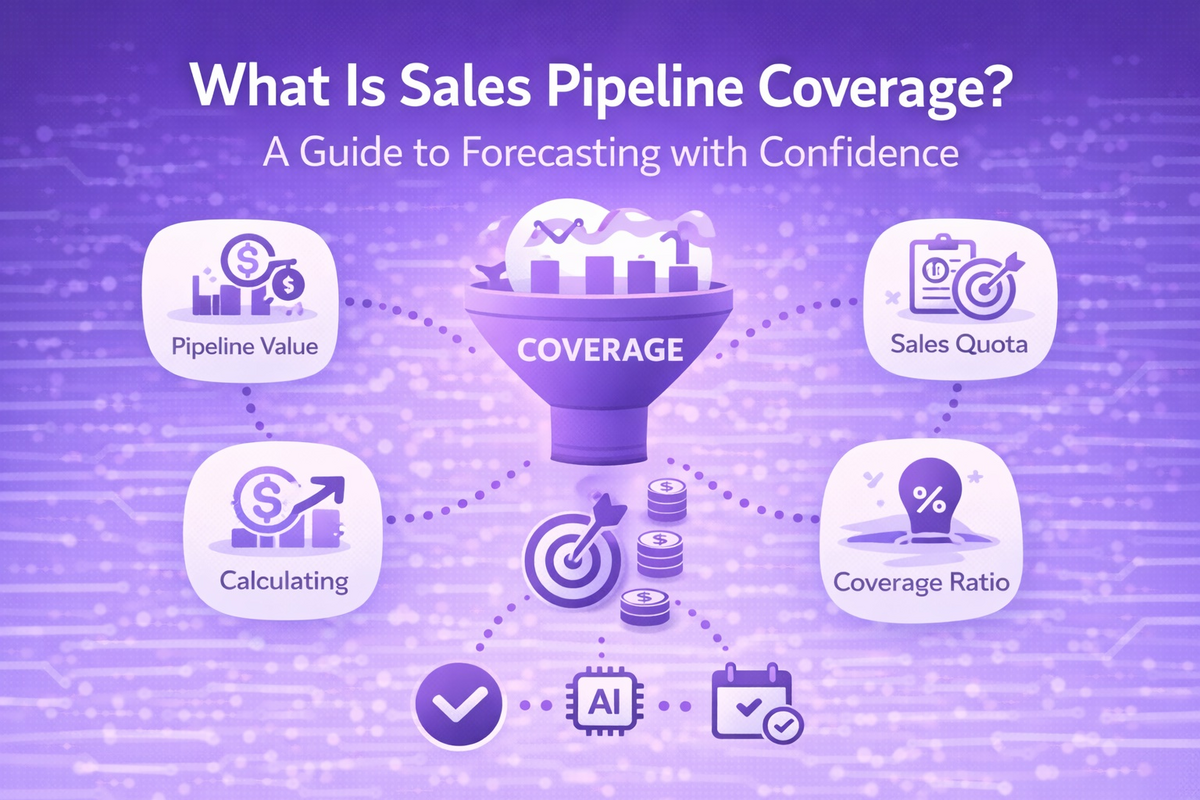
What Is Pipeline Coverage Ratio? A Beginner’s Formula and Benchmarks
Pipeline coverage ratio compares the total value of your open sales opportunities to your revenue target for a given period. You calculate it by dividing total pipeline value by your quota, and the result tells you whether you have enough deals in play to realistically hit that number.
If you’ve ever sat in a forecast call and heard someone say “we’re at 3x coverage, we’re fine,” you’ve bumped into this metric already. But that single number hides more than it reveals, and most teams lean on it without understanding what’s actually driving it.
Let’s fix that.
What Is Pipeline Coverage Ratio?
Pipeline (your sales pipeline) is the collection of open deals your sales reps are actively working, tracked in your CRM (customer relationship management software, the system that stores your deals and contacts). Pipeline coverage ratio takes the total dollar value of that pipeline and compares it against your revenue target.
A sales pipeline coverage ratio compares the value of qualified opportunities in a defined period with the quota for that same period, answering a simple question: do you have enough real pipeline to hit your number this quarter or year? It’s not asking whether pipeline exists. It’s asking whether enough of it exists.
How Do You Calculate Pipeline Coverage Ratio?
The formula is genuinely simple, even if the inputs behind it aren’t. Pipeline Coverage Ratio equals Total Qualified Pipeline Value divided by Revenue Target, and a $1.5M pipeline against a $500K quarterly quota works out to 3x coverage.
Here’s what that means in plain terms: if your team has $3 million in open pipeline and a $1 million quota, your coverage ratio is 3x, and you’d need to close about one out of every three dollars sitting in that pipeline to hit your number.
The tricky part is what counts as “pipeline.” Only qualified opportunities that are actively being worked should count, not every stale lead sitting in a CRM stage with a dollar sign attached.
What’s a Good Pipeline Coverage Ratio?
There’s no single universal answer here, and honestly, anyone who hands you one flat number without asking about your win rate is giving you a guess dressed up as a benchmark. That said, the research does point to some useful ranges.
Most sales experts recommend maintaining coverage between 3x and 6x your target, depending on your industry and conversion rates. Broken down by segment, enterprise sales teams typically maintain 3-5x coverage to account for longer sales cycles and multiple stakeholders, while mid-market B2B teams often target 2.5-4x coverage, and high-velocity SMB sales may operate effectively with 2-3x coverage.
Those ranges roughly line up with what other pipeline-management resources report too: different segments need different coverage ratios, with enterprise deals needing 4:1 to 6:1 coverage because of longer cycles and lower win rates, mid-market landing around 3:1 to 4:1, and SMB comfortably running 2:1 to 3:1 thanks to faster decisions.
Why Your Win Rate Matters More Than the Ratio Itself
This is the part most beginner explanations skip, and it’s the part that actually matters. Your required coverage ratio is the mathematical inverse of your win rate: if your team closes 20% of opportunities, you need 5x pipeline to reliably hit target, and applying a generic 3x benchmark without adjusting for your actual conversion rate is one of the most common forecasting errors revenue leaders make.
Put another way, a 3x ratio only works if your team closes roughly one in three qualified deals. If your reps close 25%, you need 4x. If they close 33%, 3x is fine. It’s just math, but it’s math a lot of sales leaders skip because 3x is the number everyone’s heard before.
Pro tip: before you set a coverage target, pull your team’s actual win rate from the last two to four closed quarters and divide 1 by that number. That’s your real required coverage, not the industry rule of thumb.
Weighted vs. Unweighted Pipeline Coverage
You’ll also hear people talk about “weighted” pipeline. Unweighted coverage sums all deal values at face value, while weighted coverage typically adjusts each deal’s value by its probability of closing based on its current stage.
Tracking both gives you a fuller picture: unweighted coverage shows volume, weighted coverage shows likelihood, and together they show you most of what you need to know about pipeline health.
How to Calculate Your Pipeline Coverage Ratio: A Quick Checklist
- Pull your revenue target for the period (monthly, quarterly, or annual).
- Filter your CRM to only qualified, actively-worked opportunities, not every open record with a dollar value attached.
- Sum the total value of that filtered pipeline (unweighted), and optionally calculate a stage-weighted version too.
- Divide total pipeline value by your revenue target.
- Compare that ratio against 1 divided by your team’s historical win rate, not just a generic 3x or 4x rule.
- Recheck weekly. Coverage at the start of a quarter is a much better predictor of the outcome than coverage checked halfway through.
Common Mistakes That Skew the Ratio
The biggest one? Counting deals that were never real to begin with. Most teams inflate their coverage by counting everything in the CRM that has a dollar amount, which produces a comforting ratio that can turn into a missed quarter once you realize a big chunk of that pipeline was never going to close.
The other common mistake is mismatching your measurement window to your sales cycle. If your typical deal takes 90 days to close, measure coverage against the current quarter. If it takes six months, you need to look two quarters out, otherwise you’re comparing pipeline that can’t possibly close in time against a target that assumes it will.
Sound familiar? If your forecast calls keep producing surprises, there’s a decent chance your coverage math and your sales cycle length aren’t talking to each other.
Frequently asked
What’s the difference between pipeline coverage and pipeline velocity?
Coverage tells you if you have enough total pipeline value to hit a target. Velocity measures how fast deals move through your funnel and translates into revenue over time. They’re related, but coverage is a snapshot and velocity is a rate.
Is a higher pipeline coverage ratio always better?
Not necessarily. A very high ratio can just mean your CRM is full of stale or unqualified deals nobody’s actually working, which looks reassuring on a dashboard and means nothing in practice.
How often should we check our pipeline coverage ratio?
Weekly, at minimum, especially heading into the final month of a quarter. Coverage measured at the start of a period predicts the outcome far better than a mid-quarter check-in.
Does pipeline coverage ratio differ by industry?
Yes. Enterprise software teams often target higher multiples than transactional or high-velocity SMB sales teams, mainly because win rates and sales cycle lengths differ so much between the two.
What’s the single biggest mistake teams make with this metric?
Treating 3x as a universal safe number instead of calculating what their own win rate actually requires. It’s an easy fix once you know to do it.
Want the Full Pipeline Health Checklist?
If you’re new to tracking pipeline metrics, don’t try to memorize every ratio and formula at once. Sign up for Revlyn’s newsletter and we’ll send you a practical pipeline health checklist you can run through with your team this week, no CRM overhaul required.
Want a second pair of eyes on your CRM?
Tell us what feels messy today. A first conversation is for understanding your situation, not pushing a package.
Book a discovery call