
TAM, SAM, SOM Explained for First-Time Founders
Confused by TAM, SAM, and SOM? Here’s a plain-English breakdown with a real example, a step-by-step calculation method, and common mistakes to avoid.
By Rishabh ·
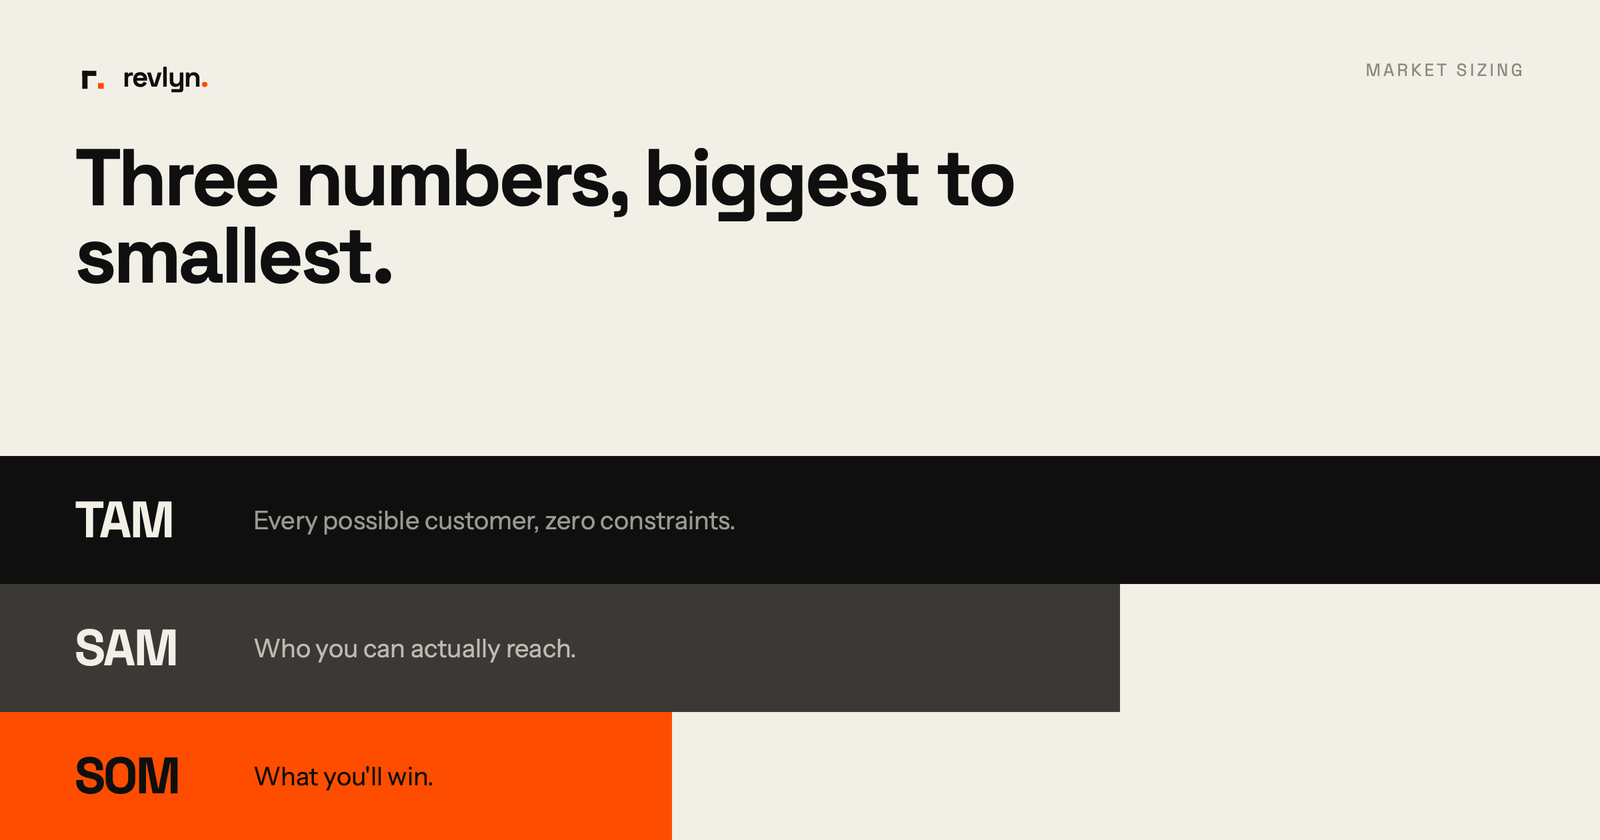
TAM, SAM, and SOM are three numbers that describe how big your market is, from biggest to smallest. TAM (Total Addressable Market) is the whole market if you had 100% share. SAM (Serviceable Addressable Market) is the slice you can actually reach. SOM (Serviceable Obtainable Market) is what you can realistically win in the near term.
If you’ve ever sat in a pitch meeting and heard someone throw out a number like “this is a $50 billion market,” you’ve seen TAM in action. But that number alone tells you almost nothing about whether a specific startup can actually make money in it.
That’s the gap TAM, SAM, and SOM are built to close. They’re not just fundraising slides. They’re a way to force yourself to answer a much harder question: who, specifically, is going to buy this, and how much of that group can you realistically get to?
What do TAM, SAM, and SOM actually mean?
Let’s take these one at a time, because each one narrows the picture a bit further.
TAM (Total Addressable Market) is the total revenue opportunity for your product or service if you captured every single possible customer. Think of it as the ceiling, the theoretical maximum with zero competition and zero constraints.
SAM (Serviceable Addressable Market) is the part of that TAM your actual business model can reach. This is where geography, pricing, product capability, and who you can legally or practically sell to start cutting the number down. As HubSpot puts it, SAM is the size of the TAM you can reasonably target as you build your audience.
SOM (Serviceable Obtainable Market) is the realistic slice of SAM you can capture given your competitive position, team size, and go-to-market capacity right now. This is the number that should actually show up in your near-term revenue plan.
A cybersecurity example makes this concrete: if you’ve built a security product for financial institutions, your TAM might be the entire global cybersecurity market. Your SAM narrows to cybersecurity spend by financial institutions in the regions where you can actually operate, and your SOM is the portion of that spend you can realistically win given your current team and competitive position.
Why does this matter for a first-time founder?
Honestly, most founders don’t skip TAM, SAM, SOM because they think it’s unimportant. They skip it because it feels like a fundraising formality instead of a tool they’ll actually use. That’s a mistake.
Getting these numbers right (or at least directionally right) shapes your product roadmap, your hiring plan, and your sales targets, not just your pitch deck. A market sizing exercise done well helps you set realistic goals and avoid overextending your team into a segment that was never going to work.
It also matters because investors read TAM as a signal of ambition and SOM as a signal of realism. A large and growing market can indicate a business has real upside, but only if the SAM and SOM show you actually understand how you’ll capture a piece of it.
Here’s the problem most first-timers run into: they build a huge, impressive TAM slide and then have no credible story for how they get from zero to their first hundred customers. That gap is exactly what SAM and SOM exist to fill in.
How do you calculate TAM, SAM, and SOM?
There are two common approaches, and you’ll likely use both.
Top-down starts with industry reports and analyst data (think Gartner or Statista) and narrows down from there. It’s fast, but it leans on assumptions from outside your business.
Bottom-up starts with your own numbers: your average sale price multiplied by the number of realistic customers you could sell to. This method is slower to build but far more credible to investors, because it’s grounded in how your business actually operates rather than someone else’s market report.
Here’s a simple step-by-step you can follow:
- Define your customer and your offer. Get specific about who you’re selling to (industry, company size, geography) and what exactly you’re selling before you touch a single number.
- Estimate TAM. Multiply your average annual contract value by the total number of potential customers who fit your definition, or use a trusted industry report as a sanity check.
- Narrow to SAM. Filter TAM by the constraints that are actually true for your business right now: geography you can service, product capabilities, pricing tier, regulatory or licensing barriers.
- Narrow to SOM. Filter SAM again based on your competitive position, brand awareness, sales capacity, and marketing budget. This is your realistic near-term target.
- Sanity-check against your current revenue. If your SOM is wildly disconnected from what your team could plausibly sell in a year, go back and tighten your assumptions.
A quick example: imagine a startup selling kitchen storage products to U.S. households earning more than $50,000 a year. If there are 40 million such households spending an average of $100 a year on kitchen storage, that puts TAM around $4 billion. From there, you’d filter down to the households you can actually reach through your channels (SAM), then to the share you can realistically win in year one given your marketing budget and competition (SOM).
Common mistakes founders make with TAM, SAM, SOM
Most of the market sizing mistakes we see aren’t math errors. They’re judgment errors.
- Sizing TAM too big. Strategy teams and founders spend a lot of time on market sizing, and most of them get it wrong in the same direction: too large. A $50 billion TAM sounds great until someone asks how you get your first 50 customers.
- Using stale or mismatched data. Markets shift fast, and combining figures from different years or sources creates projections that mislead you and everyone reading your numbers.
- Ignoring real-world constraints. Calculating TAM off pure demographics while ignoring regulatory barriers, entrenched competitors, or realistic sales-cycle length tends to produce products nobody actually buys.
- Skipping market validation entirely. According to CB Insights, roughly 42% of startups fail because there’s no real market need for their product. TAM, SAM, SOM won’t save you from a bad idea, but it forces the kind of questioning that can catch one early.
Pro tip: if your SOM is only two or three times your current revenue, treat that as a warning sign that you’re nearing saturation in your current segment, not a reason to celebrate a “strong” number.
A quick checklist before you present your numbers
- Have you defined your customer specifically enough (industry, size, geography, use case)?
- Did you build your numbers bottom-up, not just pulled from an analyst report?
- Have you accounted for competitors who already hold market share?
- Is your SOM something your current team could plausibly sell in the next 12 months?
- Are all three numbers using data from the same time period?
Frequently asked
Is SAM just a smaller version of TAM?
Not exactly. SAM applies real filters to TAM, like geography, pricing, and product fit, so it’s a meaningfully narrower and more useful number for planning.
What’s a good TAM size for a VC-backed startup?
A strong TAM for a VC-backed startup generally falls between $10 million and $300 million, large enough to signal growth potential without looking unmanageable or overly saturated.
Should I use top-down or bottom-up to calculate these numbers?
Use both if you can, but lean on bottom-up when talking to investors. It’s grounded in your own sales data rather than someone else’s assumptions, which makes it far more credible.
How often should I revisit my TAM, SAM, SOM numbers?
At least once a year, or any time your product, pricing, or target segment changes meaningfully. Stale numbers built on old data lead to bad decisions later.
Do I need fancy market research tools to do this?
No. A spreadsheet, a clear customer definition, and honest assumptions get you most of the way there. Fancy data platforms can sharpen the SAM calculation later, but they’re not a prerequisite for getting started.
If you’re still early in mapping out your go-to-market strategy, sign up for the Revlyn newsletter and we’ll send you a simple TAM/SAM/SOM worksheet you can fill in with your own numbers.
Want a second pair of eyes on your CRM?
Tell us what feels messy today. A first conversation is for understanding your situation, not pushing a package.
Book a discovery call